
Original Lisa50 research · 21,346 respondents
Relationship age gap chart: what 21,346 people told us
How much older or younger would you consider dating? Lisa50 asked people internationally about their minimum and maximum partner ages. The answers show that the direction of an age gap matters as much as its size.
The original infographic carries a 2019 copyright date. This expanded guide explains its published figures and what they suggest about dating, including dating after 50. It is an analysis of the original survey, not a new survey of current preferences.
At age 50
Women’s published partner age range was 34 to 63. Men’s was 26 to 61. Both ranges extended to younger and older partners.
At age 65
Women’s range was 43 to 69, compared with 32 to 72 for men. Both extended further below the respondent’s age than above it.
No single rule
These are average lower and upper limits. They describe the survey sample, not the preference of every person or a test of whether a relationship will work.
The original relationship age gap infographic
The horizontal axis shows respondents’ ages. The vertical axis shows the difference between their age and a potential partner’s age: above zero means older, below zero means younger. The dotted zero line represents a partner of the same age.
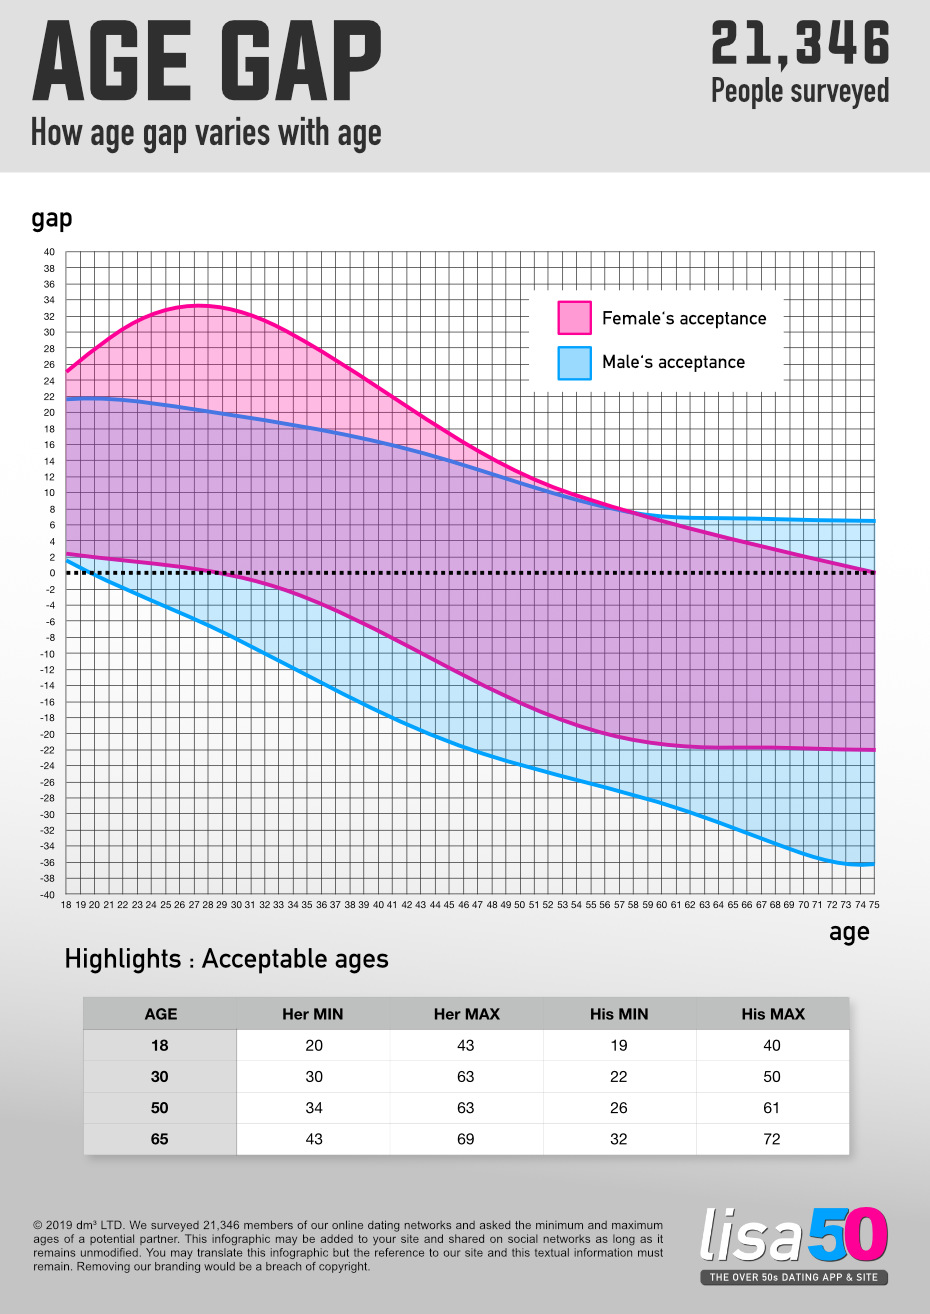
The shaded bands show average stated limits; their width does not show how many people wanted a particular age. An age inside a band is not necessarily the most popular or ideal partner age.
Age gap survey results by age
This table reproduces the four explicit numerical rows in the infographic. The age differences are calculated by subtracting the respondent’s age from each stated limit. They are not estimates read from the curves.
| Respondent age | Women’s partner ages | Women’s age differences | Men’s partner ages | Men’s age differences |
|---|---|---|---|---|
| 18 | 20 to 43 | 2 to 25 years older | 19 to 40 | 1 to 22 years older |
| 30 | 30 to 63 | Same age to 33 years older | 22 to 50 | 8 years younger to 20 years older |
| 50 | 34 to 63 | 16 years younger to 13 years older | 26 to 61 | 24 years younger to 11 years older |
| 65 | 43 to 69 | 22 years younger to 4 years older | 32 to 72 | 33 years younger to 7 years older |
Women and men refer to the survey groups. The original report describes these values as averages; it does not publish the distribution of individual answers within each group.
Six findings worth looking at more closely
1. Women’s range changes direction across the age groups
At 18, the listed range was entirely older: 20 to 43. At 30, its lower end reached the respondent’s own age. At 50 and 65, it extended to both younger and older partners, with more room on the younger side.
This challenges the idea that women always prefer older partners. More precisely, the average boundaries in this sample differed by age. The survey compared age groups; it did not follow the same women through their lives.
2. Men’s listed range broadens across the four examples
The difference between the upper and lower limits was 21 years at age 18, 28 at age 30, 35 at age 50 and 40 at age 65. These are range widths calculated from the published table, not counts of possible partners.
At the same time, the upper limit moved closer to the respondent’s own age in relative terms. At 30 it was 20 years older; at 65 it was seven years older. The broadening therefore leaned towards younger ages rather than expanding equally in both directions.
3. Women’s range is wider than men’s at 30, but narrower at 50 and 65
At 30, women’s listed range spanned 33 years, compared with 28 for men. At 50 the comparison was 29 versus 35 years; at 65 it was 26 versus 40.
It would therefore be misleading to say that one group always had the wider range. Which age group you examine changes the answer. Nor does a wider stated range tell us who is more likely to make contact or begin a relationship.
4. The same upper limit can mean a different age gap
Women aged 30 and 50 both had a published upper partner age of 63. For the first group, that was a gap of 33 years; for the second, 13 years. Looking only at the partner’s age would miss a substantial difference in the relationship between the two ages.
This is why the infographic uses age differences as well as actual ages. Both views help explain the result.
5. Dating after 50 is not restricted to an identical age
At 50, both groups’ listed ranges included their own age, younger adults and older adults. Women’s endpoints were relatively balanced around 50: 16 years younger and 13 older. Men’s endpoints were more uneven: 24 years younger and 11 older.
At 65, the younger side was longer for both groups. That leaves room for a broader conversation about later life dating than simply assuming that everybody wants someone exactly their own age.
6. A stated preference is only one side of a potential match
A person being within someone’s preferred range does not establish mutual interest. The other person has preferences too, alongside their circumstances, location and reasons for dating.
The chart cannot tell us how many compatible couples exist, how many messages received replies or which relationships lasted. It records stated age boundaries, not dating outcomes.
Explore dating after 50 at your own pace
Lisa50 gives you a place to explore profiles and meet people at a similar stage of life. Photos are optional. Joining, browsing, exchanging LIKEs and sending flirts are free; full private messaging requires an upgrade.
What is an acceptable age gap in a relationship?
In this survey, “acceptable” meant an age a respondent said they would consider in a partner. It was not a judgement about somebody else’s relationship or a recommendation that everyone should follow the average.
For adults thinking about dating, the useful question is how the relationship fits both people’s lives. Discuss expectations, independence, available time and future plans. An age difference can be worth talking about without allowing it to stand in for everything else you know about a person.
The familiar idea of using a formula to calculate a partner’s age is not the method used here. These figures came from survey answers. They should not be turned into a rule about who somebody ought to date.
What respondents said about age differences
The original report included these participant comments. They illustrate individual experiences and opinions; they are not evidence that everyone in an age group thinks alike. Wording is retained from the original report.
Female, 66, Sacramento, USA:
Younger men are great as long as there is maturity, I like their spontaneously. Older men are great as long as they aren't stuck in their ways.
Male, 51, Exeter UK:
I doubt if anyone younger than 30 would be interested in a man of 51 unless they were after money. It is often regarded as creepy, whereas if it were a woman of my age pursuing a man in his late teens and twenties, it would be more socially acceptable.
Female, 25 Las Vagas USA:
I feel weird around those younger than me when it comes to dating. It doesn't feel right. I like those older. Even if just by a year or even a day. They have to be older.
Male, 40, Ranger, USA:
I have dated a decade older and a decade younger, the only real difference is the music we like.
Female, 34, Chattanooga, USA:
I like a mentally mature man. It is great to learn from one another.
How the age gap survey was compiled
- Sample
- 21,346 members of the online dating networks, described in the original report as an international sample.
- Questions
- The minimum and maximum ages of a partner respondents would consider for a relationship.
- Comparison
- Responses were compared using respondents’ ages, with the infographic covering ages 18 to 75.
- Published groups
- Women and men. The original report says there were insufficient nonbinary responses to include that group in the analysis.
- Source and date
- Lisa50’s original infographic carries a 2019 copyright date. The published material does not specify the exact fieldwork dates.
The published report does not provide the number of respondents at each age, country breakdowns, weighting details or uncertainty estimates. We therefore do not claim that small differences are statistically significant or that these results represent every country or all adults.
Because these are historical responses from dating network members, the study cannot establish whether preferences have changed since publication. A new survey would be needed for that comparison.
Questions about the chart
Do women prefer older men?
The younger women’s groups in the published examples had ranges centred on older ages. At 50 and 65, the listed ranges extended further towards younger partners. This is a pattern in average limits, not proof of every woman’s ideal partner age.
What age range did people aged 50 consider?
In the infographic’s highlights, women aged 50 had an average range of 34 to 63 and men aged 50 had an average range of 26 to 61.
Does a larger age gap mean a relationship will fail?
This survey did not measure relationship success or duration. It cannot answer that question: willingness to consider a partner and the outcome of a relationship are different things.
Are these new survey results?
No. This article explains the original infographic bearing a 2019 copyright date. The additional comparisons are calculations from its published figures, not new respondent data.
Share or reference the age gap research
Journalists and readers are welcome to reference the findings. Please credit Lisa50 and link to this report so people can read the context. Keep the original infographic and its attribution intact. Visit the press kit or contact us for research enquiries.